
Why these key market indicators are indispensable (and how to use them to your advantage)
Last month we announced the integration of key indicators for our Prime Brokerage platform users to help them make more informed trading decisions with real-time data provided by Into the Block. These widgets will be under the new Analytics tab on BEQUANT’s proprietary platform and accessible without logging into a BEQUANT account for a limited time here.
2022 has been fast-moving and eventful when it comes to the markets so having easy access to data on one platform can make a difference. Our institutional and professional clients will be able to view some of the most useful metrics across 14+ integrated exchanges for both BTC and ETH. Data will be available in 24-hour change, 7-day change and 30-day change views.
Some of the most important factors to monitor are funding rates and open interest on perpetual futures contracts (perps). Perps dominate volume as traders can gain leveraged exposure to crypto using collateral, and because perps do not expire, hence the term “perpetual”, the funding rate ensures that the contract price mimics the underlying.
When funding rates are positive, the perpetual price is higher than the spot and indicates a positive bias so traders who are long pay for shorts. The opposite is true when funding rates are negative. The wider the difference between the spot and the perp, the higher or more negative the rate, which covers an eight-hour period.
For example, in November 2020, the BTC funding rate spiked as bitcoin began its rapid ascent to $63k, signaling bullishness. After the second run-up in November 2021, the funding rate flipped negative and has frequently been slightly negative for most of 2022.
Open interest tells us the amount of open positions, whether long or short, in the market. So while the funding rate reflects whether the positioning is bullish or bearish, open interest indicates the amount of leverage in the system. It is best to look at both in combination.
When analyzing open interest on perpetuals, periods, when it moves up more than the price, indicate capital inflows while when it moves down more than the price signals cautiousness. For instance, from July 3rd of this year, open interest rose by almost 40%, while price lagged, showing that traders were adding leveraged exposure to take advantage of the rebound. There was no clear-cut signal on the direction prices would take though, as funding rates were muted.

An interesting dynamic to watch recently has been the contango/backwardation basis on Ethereum. After developers indicated a potential merge date in September, derivatives activity took off, with options notional interest exceeding that of bitcoin for the first time ever and calls for September dominating puts. However, looking at the future term structure for ETH, it went into slight backwardation. This means that participants expect ETH to trade at a discount after the long-awaited event occurs.

While there have been net ETH outflows from exchanges, another data point we make available, the amount is not higher than last spring or fall of 2021. This could mean that traders are choosing to express their views through derivatives over spot. It could also flag a lack of general interest in the asset, as has been the case with BTC since the Luna crash.
Top traded pairs/pools on DeFi are also part of the offering, an important addition given clients now have direct access to DeFi protocols via Fireblocks with DeFi-specific collateral management, margining for select operations and cross-margining across CEXes and DEXes for more efficient arbitrage.
Keeping a close eye on liquidity helps to reduce slippage or the difference between the expected and actual price of execution of a trade. If there is low liquidity, it can create imbalances in the pool, potentially leading to large losses. Users can also observe the returns liquidity providers can achieve on the top protocols, which are a function of volume and liquidity.
One case occurred last January when a large amount of capital was drained from the Magic Internet Money stablecoin (MIM) liquidity pool on Curve. The pool became so imbalanced after it was revealed that one of the developers was a co-founder of bankrupt Canadian exchange, QuadrigaCX, that MIM briefly lost its peg.

These are just some of the ways that the data can be used.
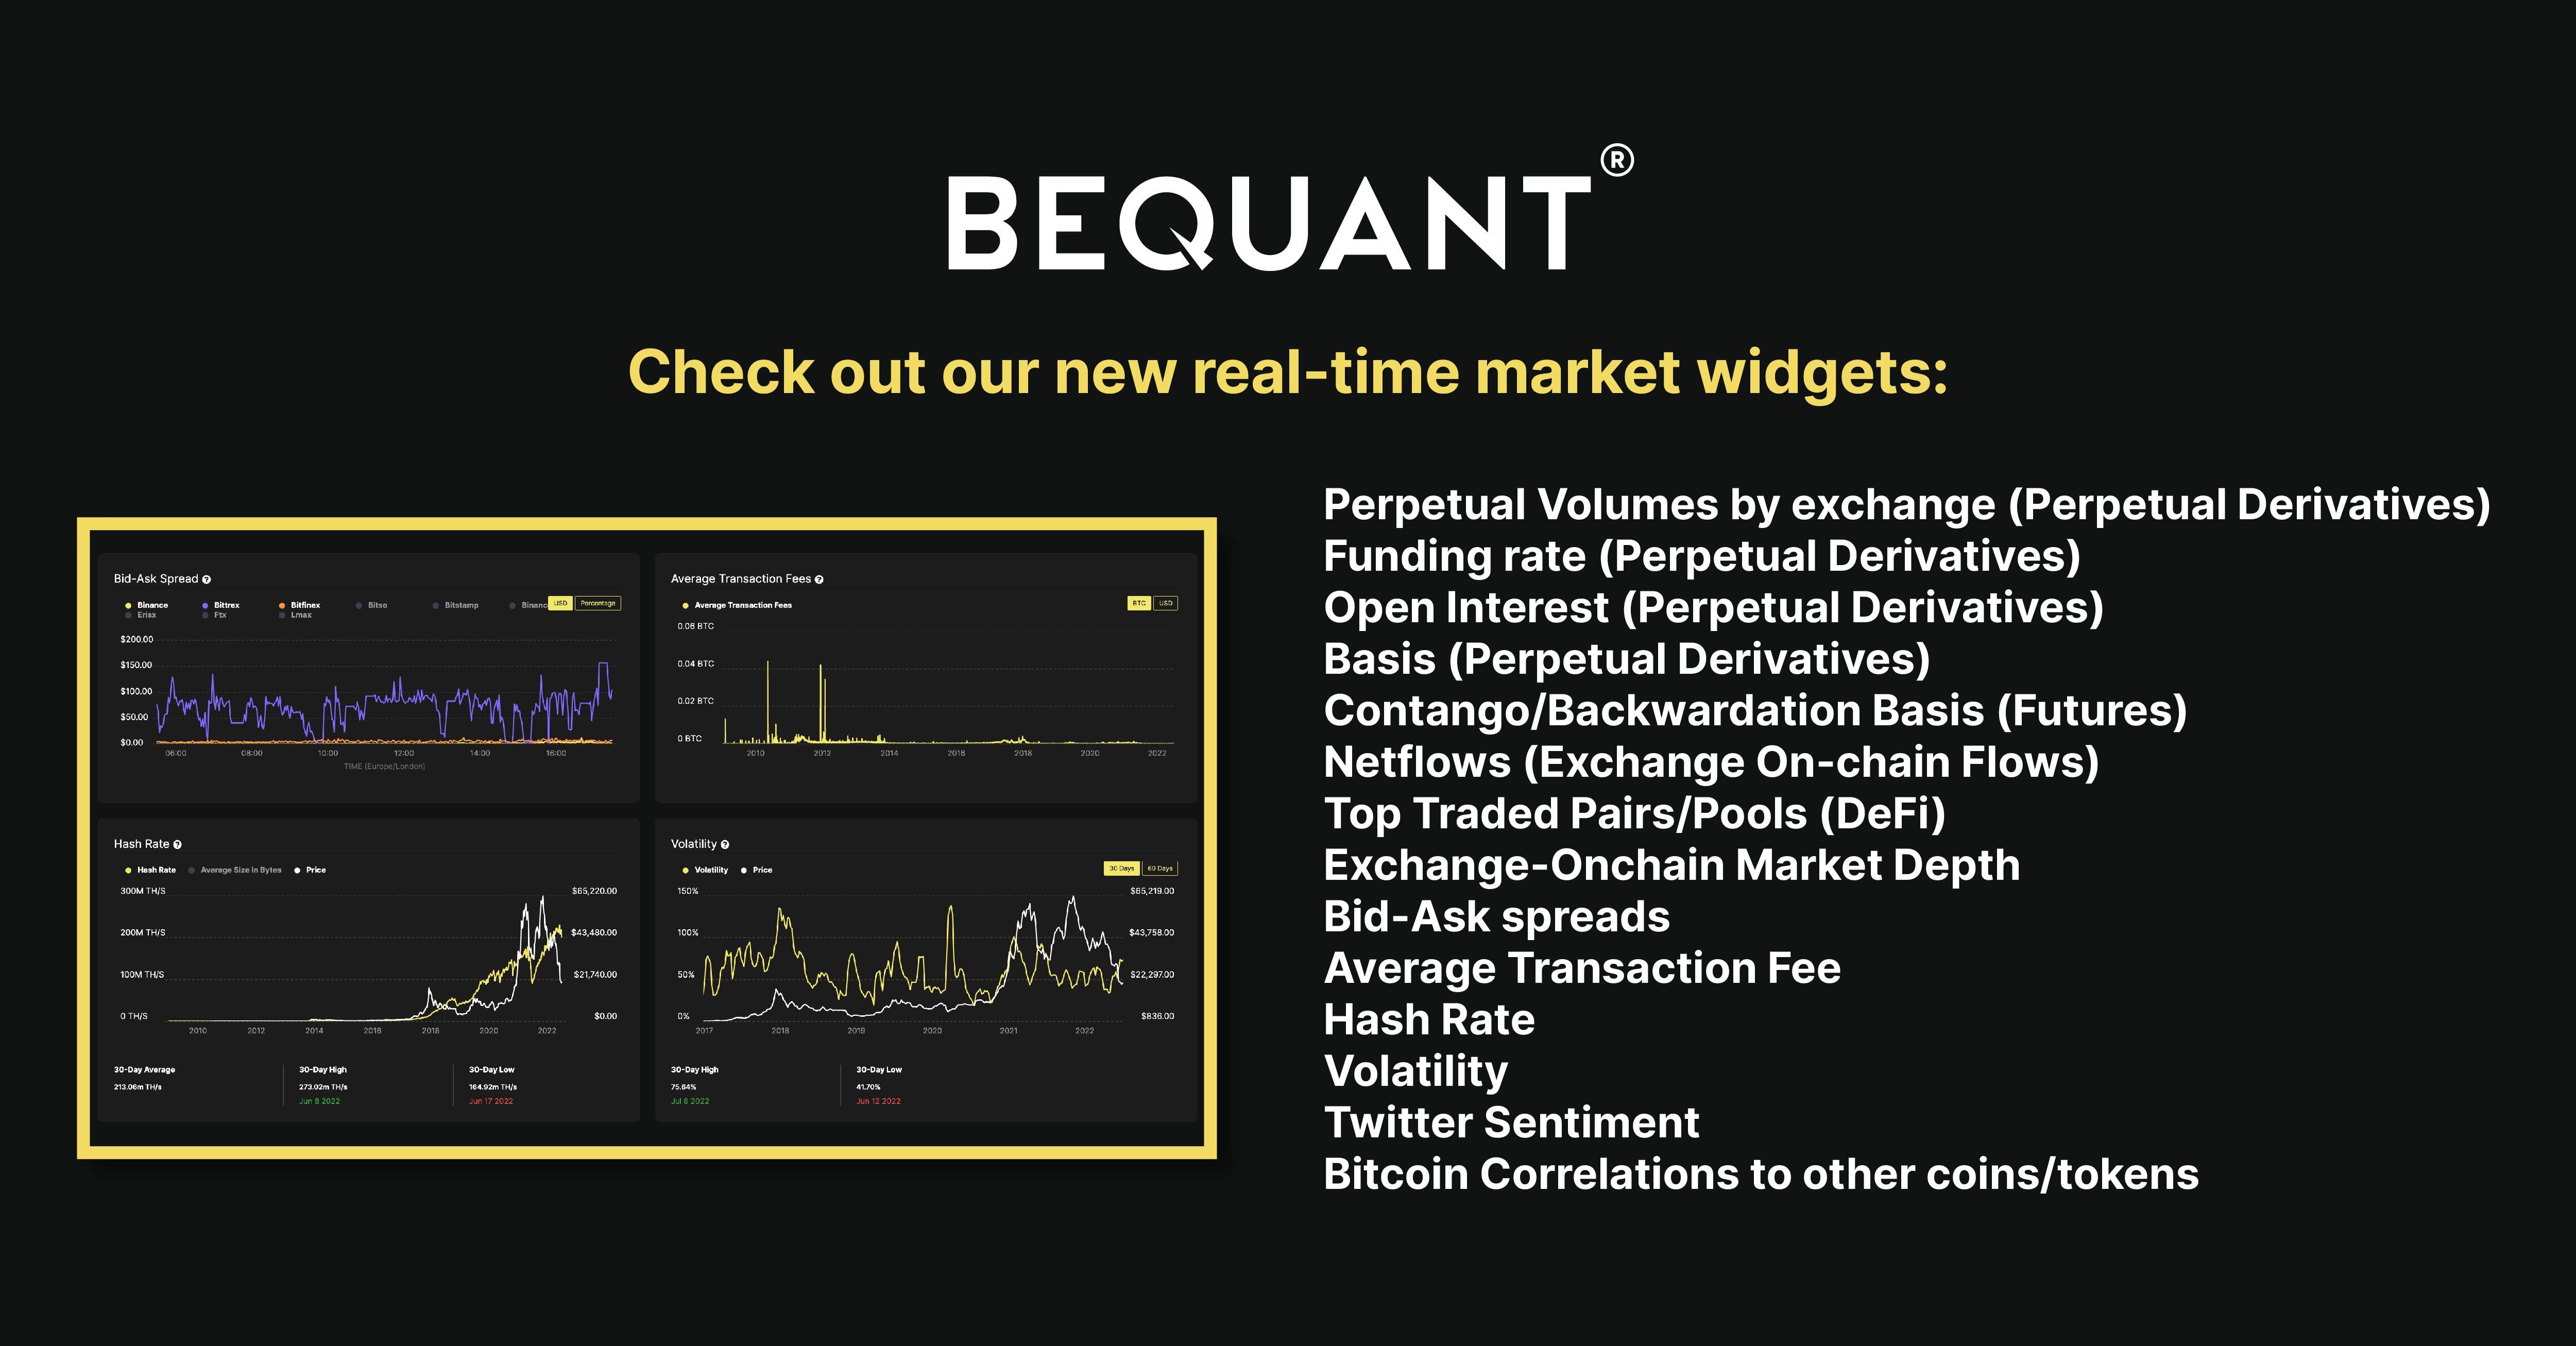
The widgets available on our BEQUANT prime brokerage platform include:
- Perpetual Volumes by exchange (Perpetual Derivatives)
- Funding rate (Perpetual Derivatives)
- Open Interest (Perpetual Derivatives)
- Basis (Perpetual Derivatives) / Contango/Backwardation Basis (Futures)
- Netflows (Exchange On-chain Flows)
- Top Traded Pairs/Pools (DeFi)
- Exchange-Onchain Market Depth
- Bid-Ask spreads
- Average Transaction Fee
- Hash Rate
- Volatility
- Twitter Sentiment
- Bitcoin/ETH Correlations to other markets
